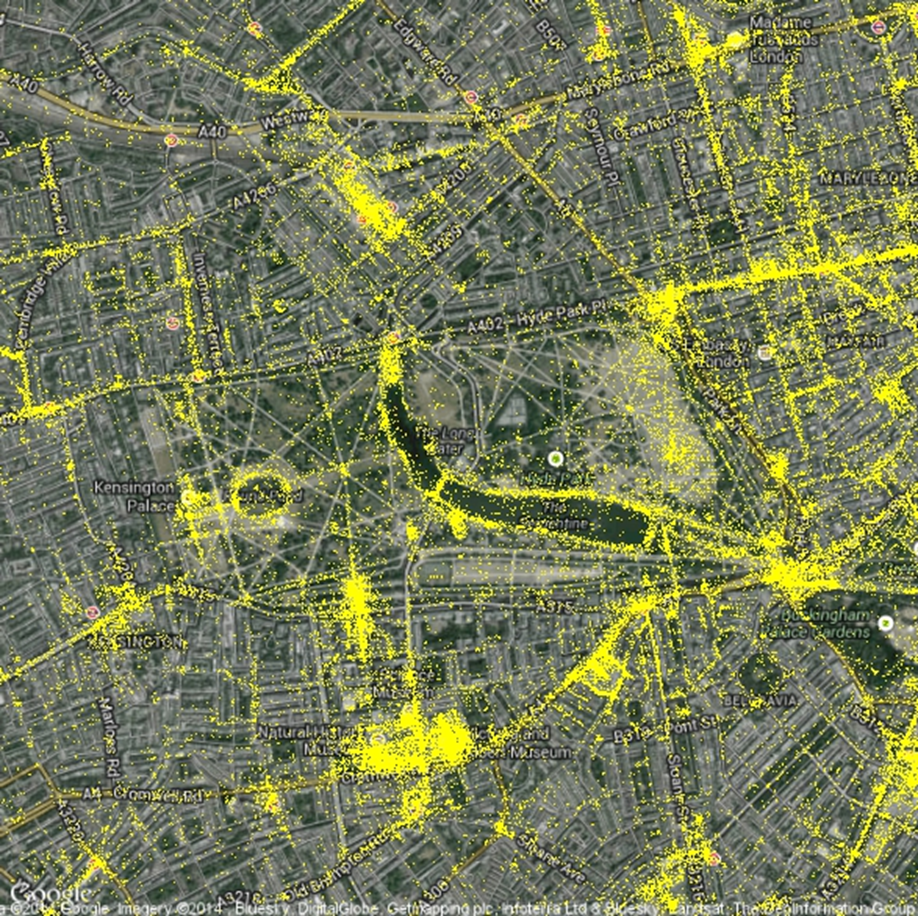
Geotagged Flickr photography in and around Hyde Park in London. Sights with visibly high levels of activity include the Serpentine, the museums in Exhibition Road. Image John Davies
Into the city
In the past, people walked the streets and left no trace. This is no longer true. We are creating large amounts of data about the places around us: how we move through them, and how they move us. One source of this data has been the growth in smart phone and social media use.[1] The geotagged social media data generated by phones and cameras is producing information on a large number of people’s interactions with their surroundings.
This data has limitations. It is not everybody; social media use is self-selecting. It is not everywhere, there is more activity in city centres. It may not be representative of local populations (e.g. tourists), and users may be appearing as distorted versions of themselves or not even be people (there are automated social media accounts and institutional ones). Nevertheless, studies of this data are starting to show that it can be used to help understand urban areas.
Waterloo Cans Festival
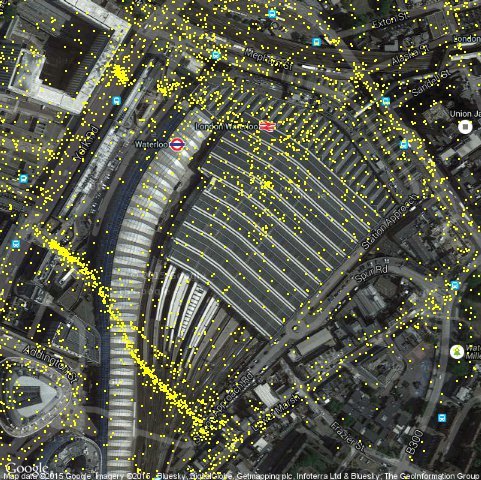
 Image shows geotagged photographic activity around London’s Waterloo station on the photo sharing website Flickr, in particular the effects of the 2008 Cans street art festival. The festival was located on Leake street which passes under the tracks of the station. This is an example of how spatial social media data can be affected by specific events. All maps shown in the post were created with Markus Loecher’s RgoogleMaps package.
Social networks of cafes
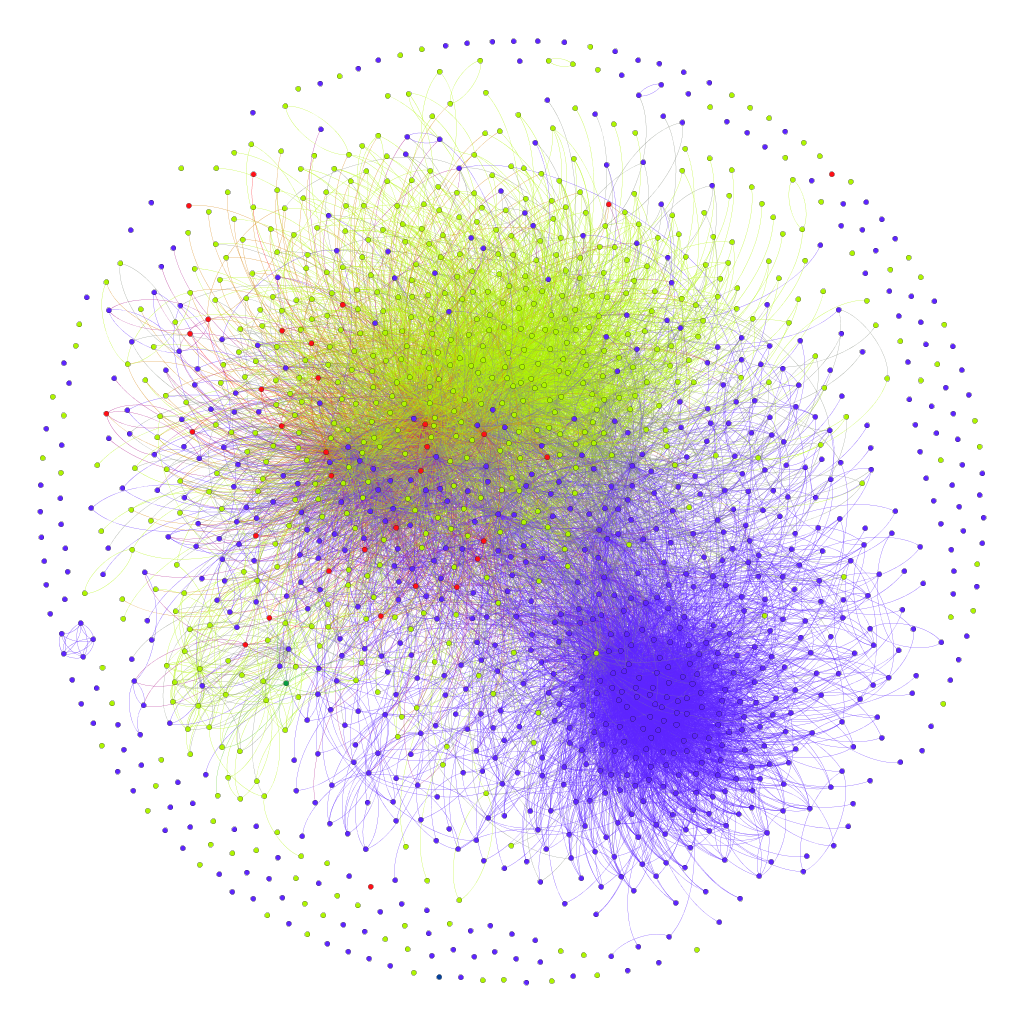
 Image shows the following network among followers of two cafes’ Twitter accounts. The cafes are on the same street. Followers of cafe A only are coloured purple and followers of cafe B only are coloured yellow (The cafes accounts themselves do not appear). Followers of both cafes are in red. Connections between those in the same following group have the corresponding colour. Unconnected dots are accounts that followed one of the cafés, but did not follow anyone else who followed a cafe (or who had restricted access to their following information).[2] For further interpretation of this picture see the end of the article.*
Emerging findings
Among areas highlighted by recent studies showing how social media and new analytical approaches can be used to understand our interactions with places, are:
Understanding the walkability of streets using Flickr photography and Foursquare data [3] Daniele Querica, Luca Aiello, Rossano Schifanella and Adam Davies have analysed 7 million geo-tagged Flickr photos in central London and how they relate to the walkability of over 3000 street segments. A street’s walkability is measured using an index of publicly available indicators including traffic accidents and crime statistics, proximity to green space and the size of pavements. The research found that safer streets were more likely to have been photographed at night, and by older people.[4] [5] It also found that less walkable streets were more likely to be associated with certain photographic tags such as those mentioning cars (although the strength of this relationship related to levels of photography on a street –as not all photos were tagged). Using data from the social media platform Foursquare on the venues in the streets (on Foursquare people “check-in” when they arrive at a venue, e.g. a cafe, earning points and allowing their friends to see where they are). It was found that the data on the different kinds of venues on the platform was a good predictor of a street’s safety, although it was less successful at explaining walkability.
Exploring the relationship between house prices and the character of urban areas using Flickr and Picasa photography data [6] Gabriel Ahlfeldt has studied data on the locations of photographic activity in London and Berlin on Flickr and Picasa to measure what he terms urbanity. Urbanity being a mixture of an area’s leisure and entertainment offer, and the attractiveness of its architecture and spaces. In the analysis he uses extensive information on the location of pubs, restaurants, historic buildings, theatres, museums and other things which affect local environments and photographic activity.[7] He found that the varying levels of photographic activity can be split into two parts: activity that can be explained by the other data on area characteristics in the analysis and activity that cannot be related to it. When adjusting for other factors that affect house prices (e.g. the centrality of location, size of local population etc.) it is still found that the photographic activity which is not explained by the local area characteristics is associated with higher house prices. This suggests that the photographic data is capturing something about places that people value economically, but which is not reflected by other data.
Learning how people perceive areas’ safety from their appearance on google Street View Analytical techniques from machine learning are allowing not just location data, but the photographs and textual information associated with it to be analysed.[8] Many of these techniques were developed for pattern recognition, such as identifying licence plate numbers or faces in photographs. One application of this to social media data has been to reconstruct the 3D shapes of buildings from photographs taken by tourists in historic areas on Flickr.[9] [10] Although not a study of social media data per se, analysis by Nikhil Nake, Jade Philipoom, Ramesh Raskar and César Hidalgo of MIT’s media lab highlights how these techniques can be used to understand the way people perceive an area’s appearance from photographic data.[11] Their study used over 7000 people’s inferred rating of streets’ safety in Boston and New York, obtained from a crowd sourcing study where participants chose which was the safer looking of two street images from google Street View. Machine learning techniques were then used to analyse the relationship between the statistical properties of the pictures and the corresponding safety scores. A mathematical model was built that when fed a Street View image predicted what the street’s safety score would be. This model was then used to analyse over a million Street View images from the streets in 21 US cities, generating estimates of how people would have assessed their safety.[12] It indicates how visual information collected in one set of areas can be linked to people’s perceptions to try and learn general lessons applicable to other areas.
Three potential destinations
This is a rapidly changing area, but three possible implications of this growing data on our interactions with the built environment could be:[13]
1) Social media data informing architecture and planning It seems likely that research findings from this data on people’s engagement with places could inform thinking in architecture and planning.[14] The studies discussed do not directly assess the effects of changes in an area’s built environment over time on social media activity, but as more and more data is accumulated that should increasingly be possible, allowing us (in conjunction with other data) to develop an ever richer picture how we are affected by our surroundings.
A potential concern might be that such an empirical approach will lead to society steering itself into an architectural cul-de-sac guided by the rear-view mirror of past successes. However, research by Hasan Bakhshi, Carl Frey and Michael Osborne which used machine learning to analyse the skills of different occupations has shown that architecture and planning involve creative skills that are unlikely to be automated any time soon.[15] A more optimistic view is therefore that better data on people’s responses to places will act as a fresh source of inspiration. Interestingly, one aspect of the photographs which the Media Lab study found difficult to capture was the effects on people’s safety assessment of atypical architectural styles. This may partly reflect that, by definition, there is less data to study for such architecture, or that it elicits mixed responses, but it seems plausible that we will get a better understanding of this in future. Another issue is that social media data is skewed towards specific groups and places, and so does not reflect society or urban areas as a whole. The selectivity of the data is though well known, and building on the methods already used, it is likely that increasingly sophisticated ways will be found to adjust for this.
2) This higher resolution and velocity data on the built environment affecting economic decisions in the property market Activities on Twitter and Flickr can be tracked in real-time and, if geotagged, at high levels of geographic resolution, allowing people’s engagement with areas to be analysed in much more detail. As the Ahlfeldt research shows, it is possible to link this kind of data to economic measures of an area’s desirability. A potential implication of this could be that areas’ growth, or decline, will be accelerated as it becomes clearer to developers and individuals where and when this is happening. It can also be argued that this will encourage urban segregation, with people avoiding areas that the data implies are less desirable. The latter issue is though not unique to social media data. Relatively high-frequency data on local areas is anyway already available; house price data in the UK is for example obtainable from the land registry two weeks to two months after sale. In addition, regardless of the data’s increasing frequency, financing, contracting, design and construction can still take significant amounts of time. Data has sped up, but a lot of other things haven’t.
3) The access and privacy issues surrounding the data becoming more important The above implicitly assumes that this growing data source continues to remain readily available, but it is not inconceivable that data access and privacy issues might affect this.
The data discussed here is collected by a small number of search and social media platforms, and is to varying degrees available (subject to restrictions imposed by the platform and participants privacy settings) often at no cost. This access is currently part of the platforms’ business models, but it is possible that access could be more restricted in future if there was commercial gain from it (Foursquare has for example introduced charging for some of its data for specific customers). Restrictions on access could have implications for people trying to build businesses around this data and anyone wanting to obtain the data for research purposes. The relationship between the platforms’ data, their business models and other direct commercial uses of the data is a central issue not covered in this post.
Related to access is privacy. People on the more public social media platforms discussed here, by and large, want others to know who they are, or at least know their work. However, it is probably also true that, while covered in the often lengthy terms and conditions, many users are not aware that their social media activity can on some platforms be systematically collected and analysed by third-parties. As more people realise this they may be less willing to share their location data and/or demand platforms restrict access.
In short, our cities are increasingly being covered by a resource: our social media data. A resource that could affect our built environment and economic activity, and one where access and privacy issues are likely to become more important. We have been individually documenting our environment without collectively realising it and, as a result, a new phase in our relationship with our surroundings is about to begin.
Blow Up, Maryon Park
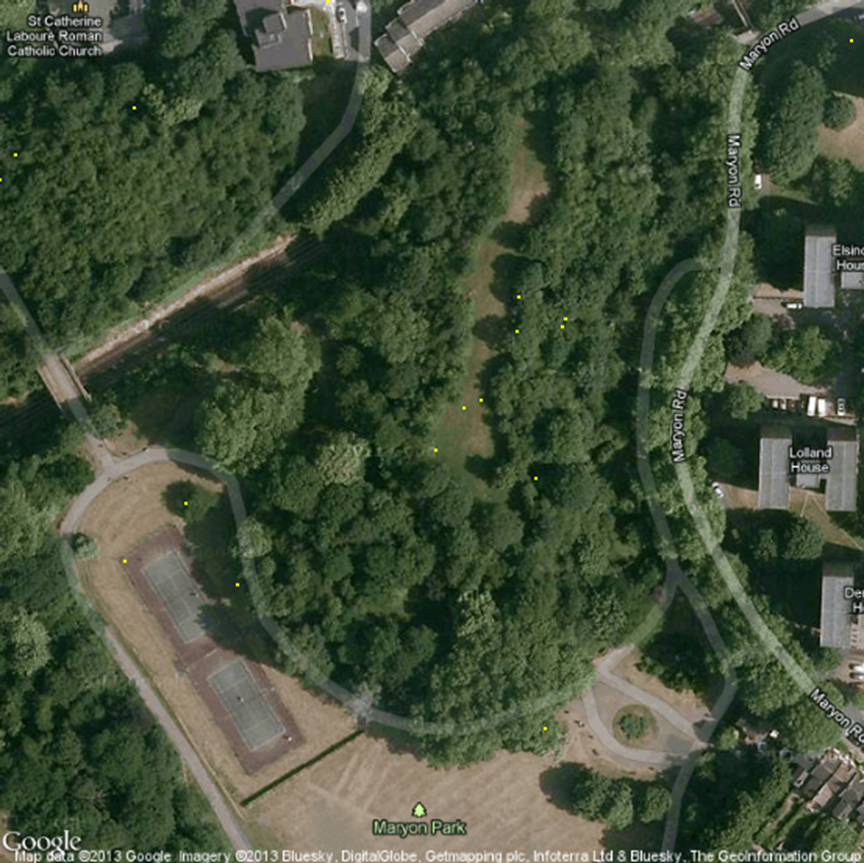
 Maryon Park in Charlton, London, setting of one of the city’s most famous fictional photographic incidents, from Michelangelo Antonioni’s 1966 film Blowup, where a photographer takes some photographs that lead to a disturbing discovery.
A version of this article has previously been published as part of the British Academy’s Where we live now project.
References
[1] Two further sources of mobile related data not discussed here are the use of mobile location data (mobile phones give out a signal which indicates their location, allowing it to be studied) and crowd sourced survey data (the Media lab paper aside). Smart phones are allowing people to be surveyed through their phones enabling spatial survey data to be collected. An example of this is the Mappiness project of George MacKerron where people were surveyed to assess their wellbeing via their phones allowing this to be related to their surroundings. MacKerron, G. (2012), ‘Happiness and environmental quality’, PhD thesis, LSE. People are also collaborating online to generate spatial data, as in OpenStreetMap. In addition, the falling cost of monitoring and storing data is resulting in greater volumes of data on cities from other sources such as transport systems. The overall growth in data is part of what is driving the smart cities agenda. BIS (2013), ‘Smart cities: background paper’ and Saunders, T. and Baeck, P. (2015), ‘Rethinking smart cities from the ground up’, Nesta.
[2] For an example of the use of social media network data to understand community groups see Marcus, G. and Tidey, J. (2015), ‘Community Mirror A Data-Driven Method for ‘Below the Radar’ Research’, Nesta.
[3] Quercia, D., Aiello, L., Schifanella, R. and Davies, A. (2015), ‘The Digital Life of Walkable Streets’, The International World Web Conference Committee (IW3C2).
[4] The measures used in the paper adjust for the fact that photographs are more likely to be taken in the daytime. The measure is broadly speaking whether the street is more likely to be photographed at night relative to average photographic activity at night across all streets, compared to an equivalent measure for daytime photography.
[5] For a study linking Twitter activity with crime levels see Bendler, J., Antal, R. and Neumann, D. (2014), ‘Crime Mapping through Geo-spatial Social Media Activity’, Thirty Fifth International Conference on Information Systems, which looks at the connections between the two in San Francisco.
[6] Ahlfeldt, G. (2013), ‘Urbanity’, CESifo working paper No 4533.
[7] The study addressed the issue of tourists skewing photographic activity by separating out individuals who had taken photographs over a period longer than thirty days as residents.
[8] For introductions to this area see: Armstrong, H. (2015), ‘Machines that Learn in the Wild’, Nesta. and the textbook Alpaydin, E. (2014), ‘Introduction to Machine Learning’, MIT press.
[9] Agarwal, S., Furukawa, Y., Snavley, N., Curless, B., Simon, I., Seitz, M. and Szeliski, R. (2011), ‘Building Rome in a Day’, Communications of the ACM.
[10] The Quercia et al. study also used photos’ machine-generated tags in addition to those assigned by the photographer.
[11] Naik, N., Philipoom, J., Raskar, R. and Hidalgo, C. (2014), ‘Streetscore-Predicting the Perceived Safety of One Million Streetscapes’, CVPR Workshop on Web-scale Vision and Social Media.
[12] The validity of the extrapolation outside of the original areas was assessed by analysing how far a city’s score for average perceived safety diverged from the relationship between average median family income and average perceived safety for a geographic subset of the sample (9 cities within 200 miles of New York) i.e. if an area had a much higher or lower safety assessment than might have been predicted from this analysis then the extrapolation was considered less robust. In Arizona, for example, the city safety scores diverged from what one would have predicted based on the cities’ income and the relationship in the east-coast sample.
[13] For a discussion of this area see Tasse, D. and Hong, J. (2014), ‘Using social media data to understand cities’, Carnegie Mellon University.
[14] One possible application could be to inform decisions on whether buildings should receive planning protection. Davies, J. (2014), ‘Heritage in Space’ Nesta blog.
[15] Bakhshi, H., Frey, C. and Osborne, M. (2015), ‘Creativity vs Robots. The creative economy and the future of employment’, Nesta.
Note on interpreting the cafe network diagram The follower groups are quite distinct suggesting the cafes target different kinds of customers. This may well be true, but in fact a number of the followers shown are the Twitter accounts of businesses $
