In addition to work on the creative industries I have done a number of other data projects.
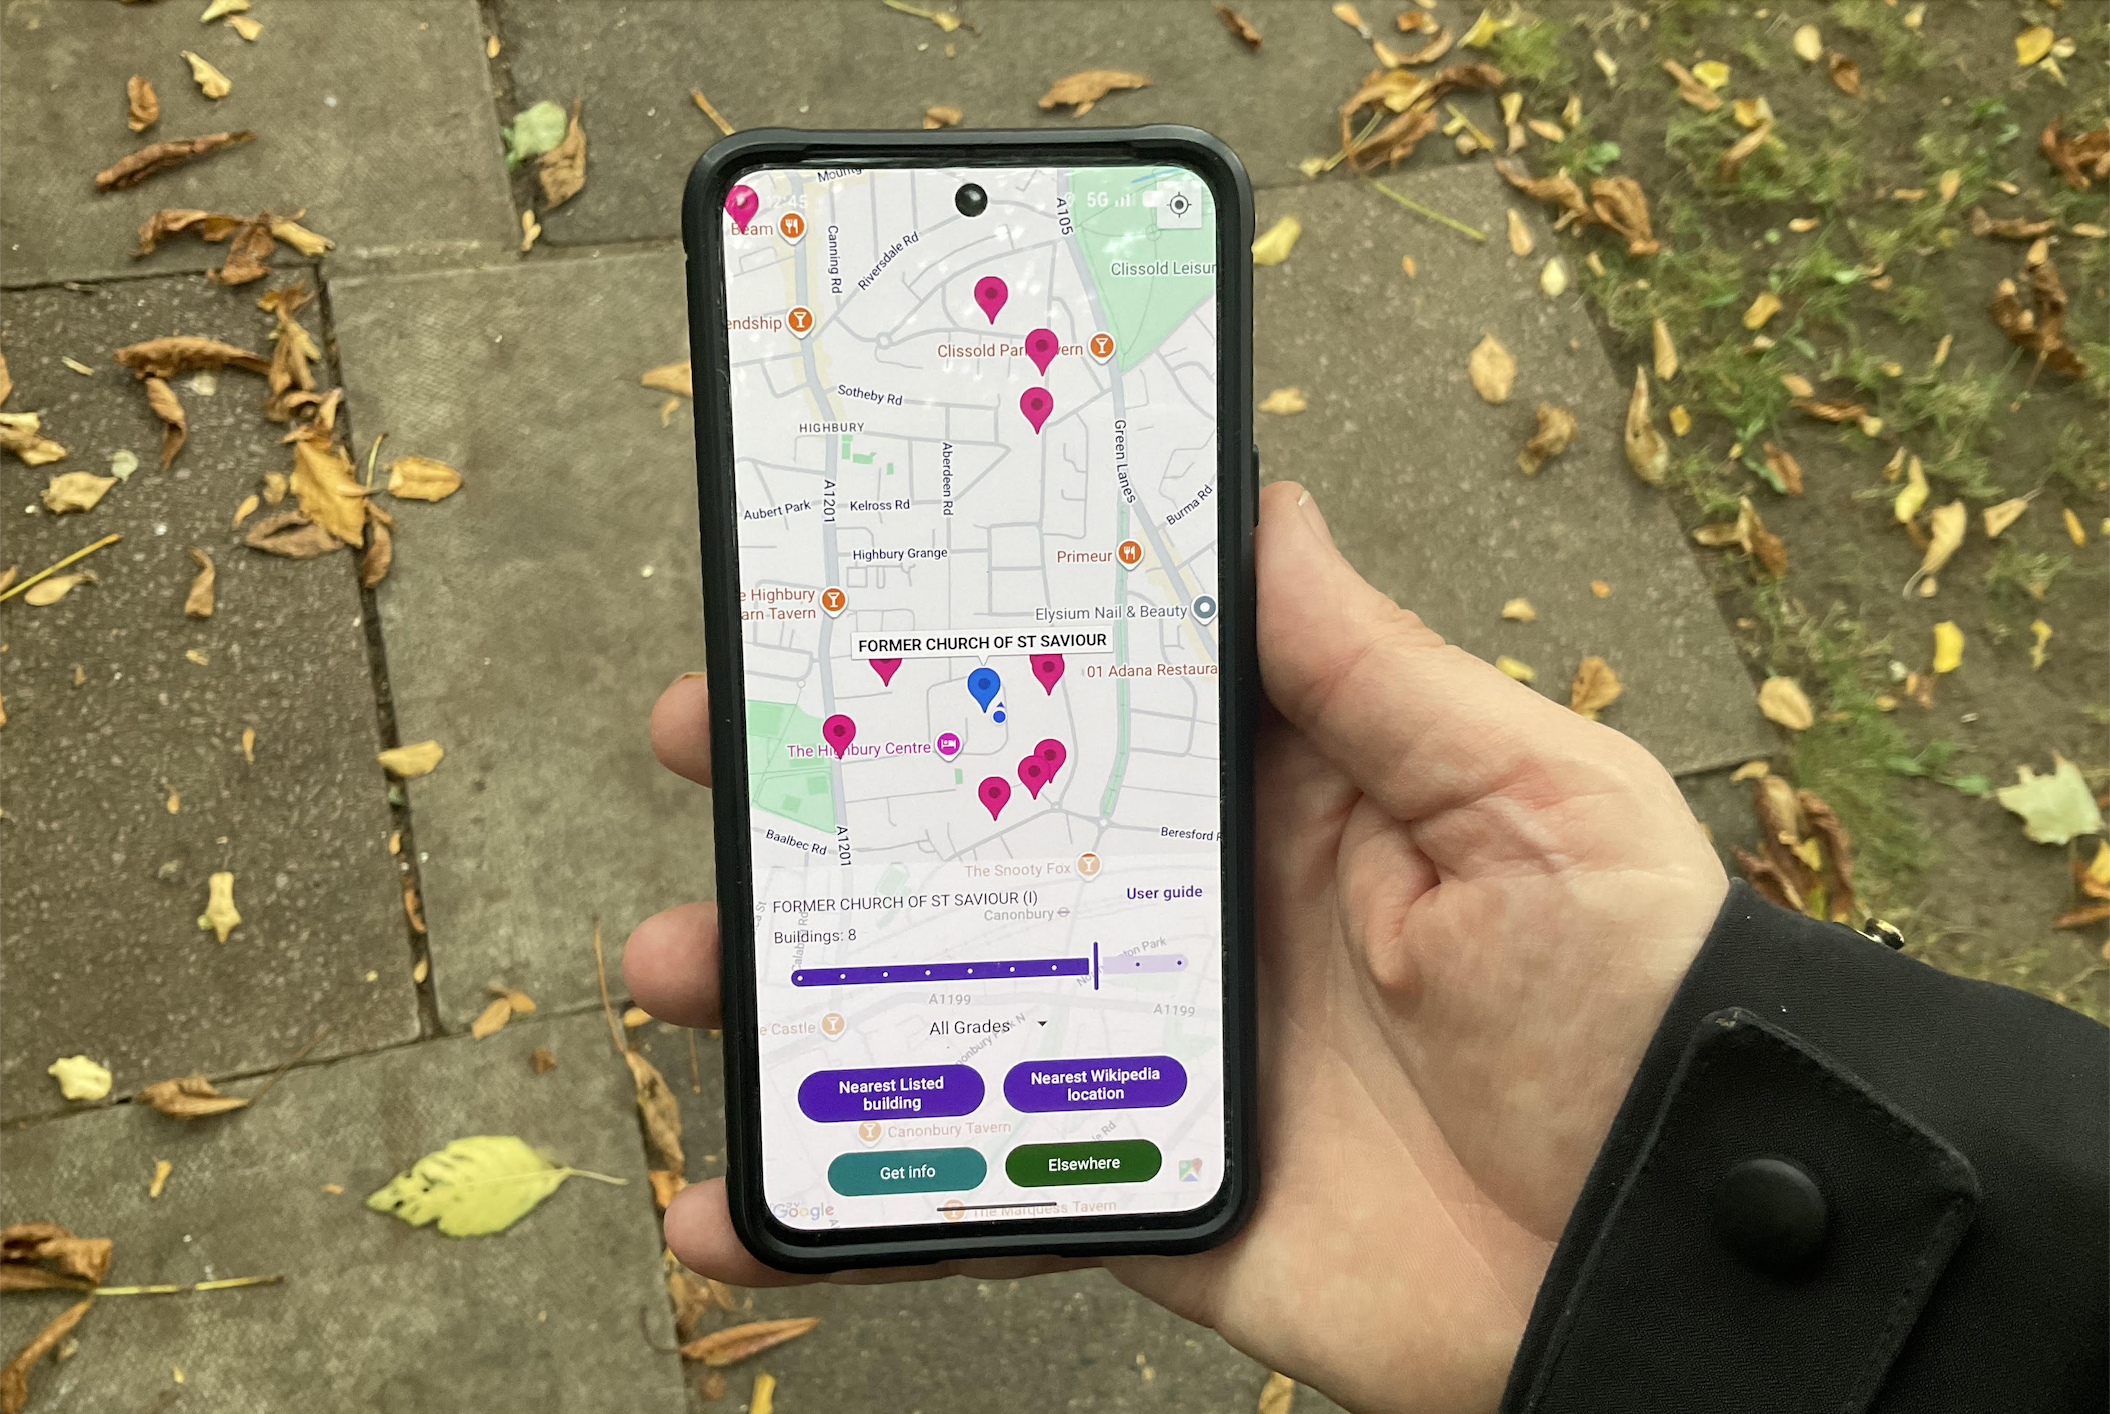
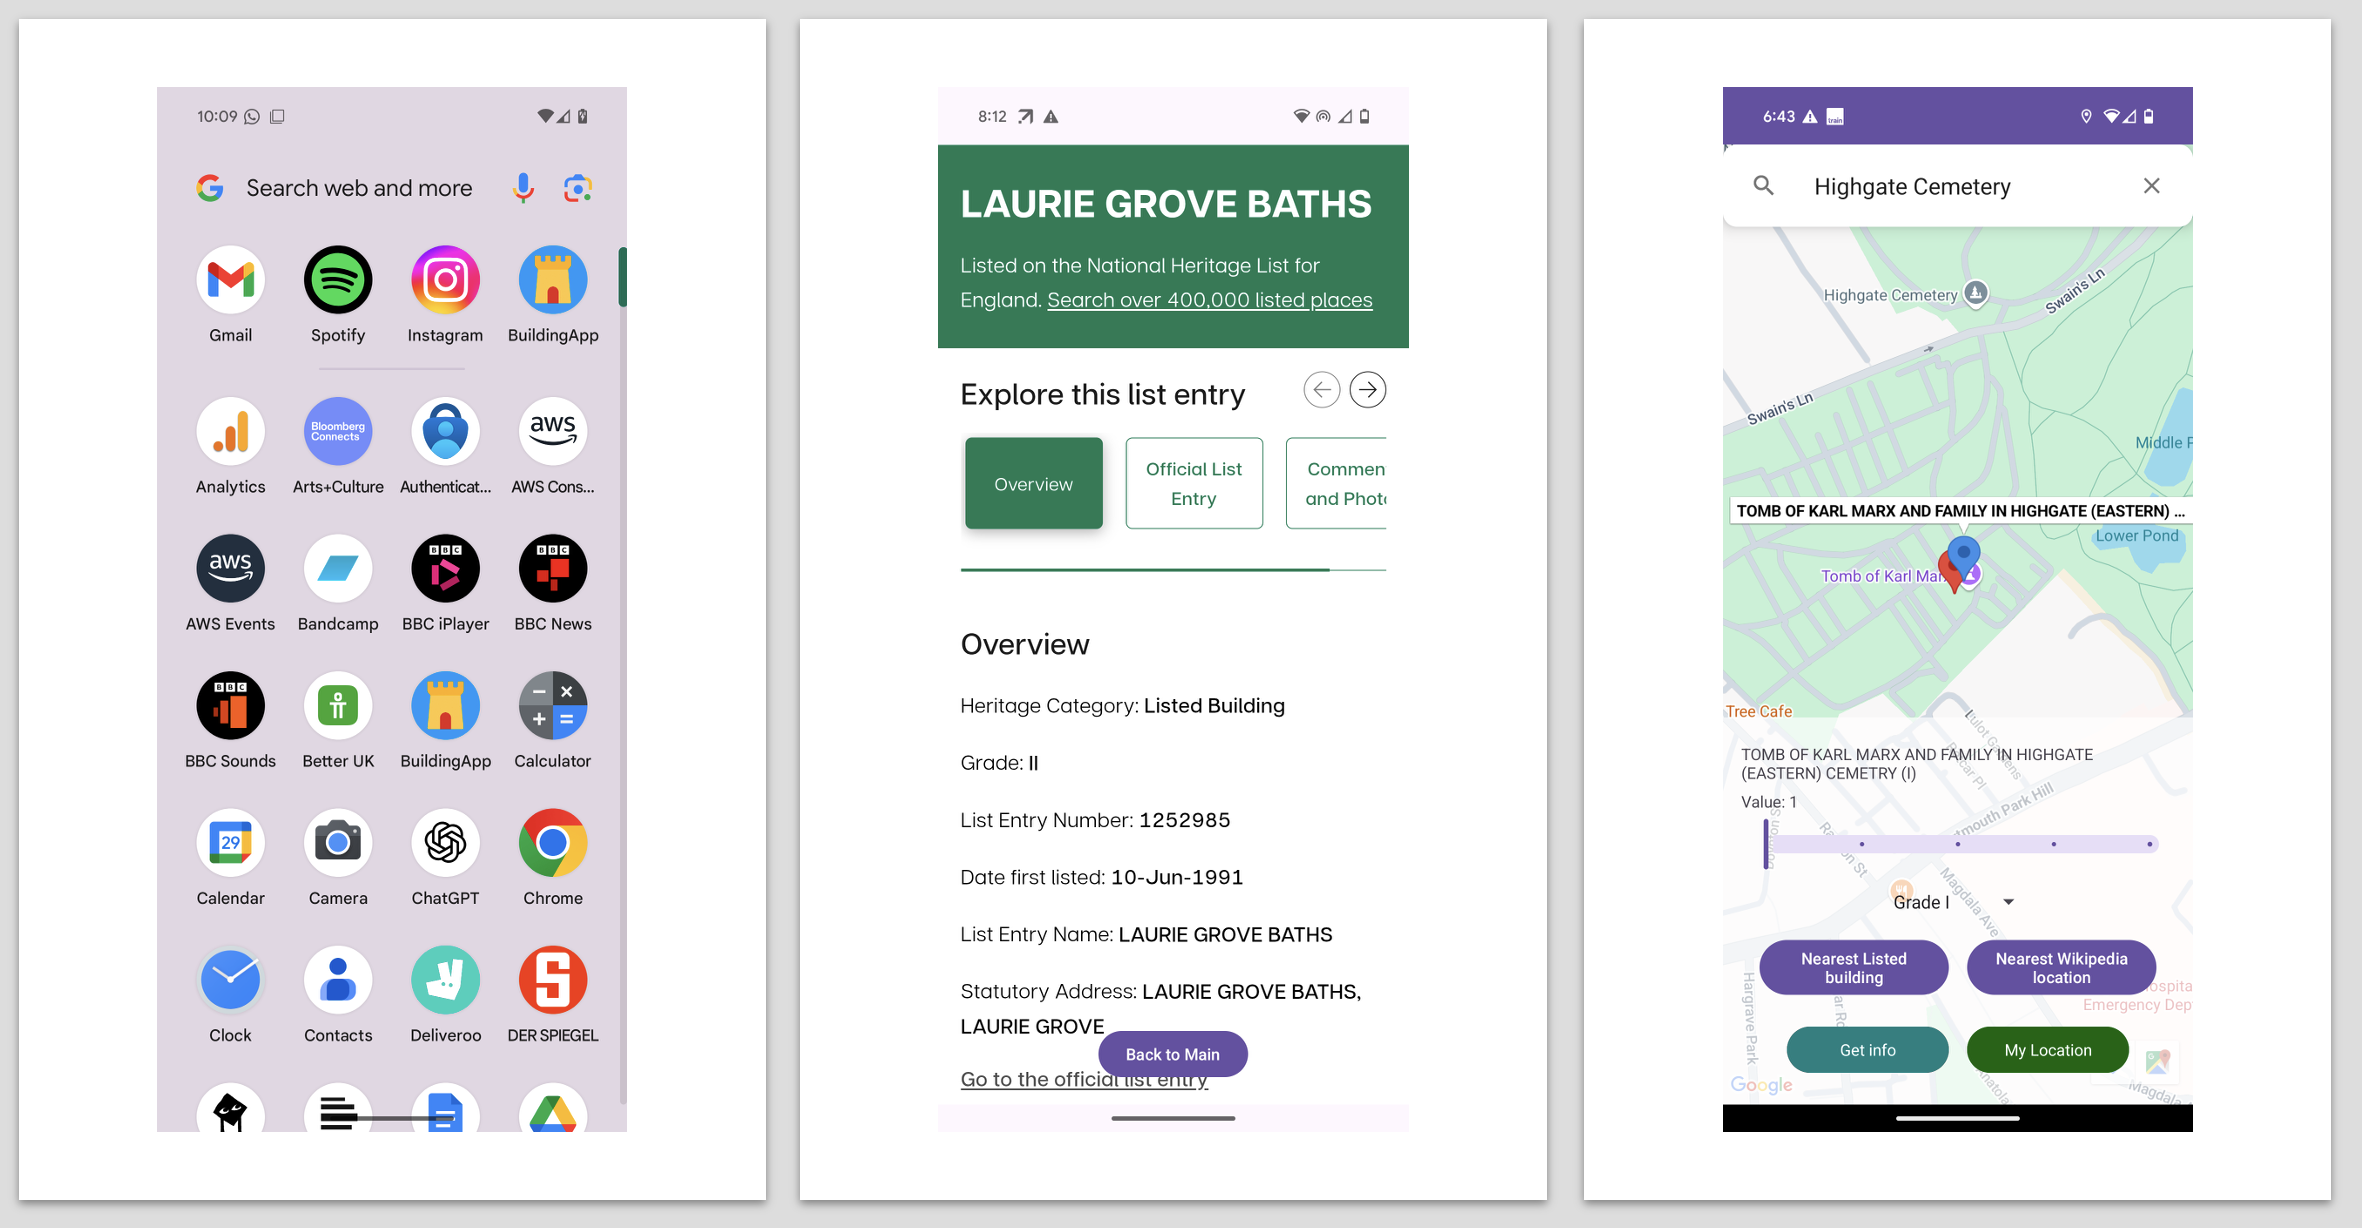
Listed buildings mobile app
An Android app (BuildingApp) that shows users the location of their nearest listed historic buildings in the UK and the Republic of Ireland and gives access to the
corresponding listing information. To learn more about the app see the page here.
If you’re interested in using the app get in touch.
Mapping city-level food access
In partnership with the Liverpool good food initative I developed an interactive map that shows levels of access to food in the city.
The map allows food supply within the city to be visualised in terms of areas that are further away from food support initatives and which
due to higher levels of deprivation are potentially at greater risk of food insecurity. The map is accessible
here.
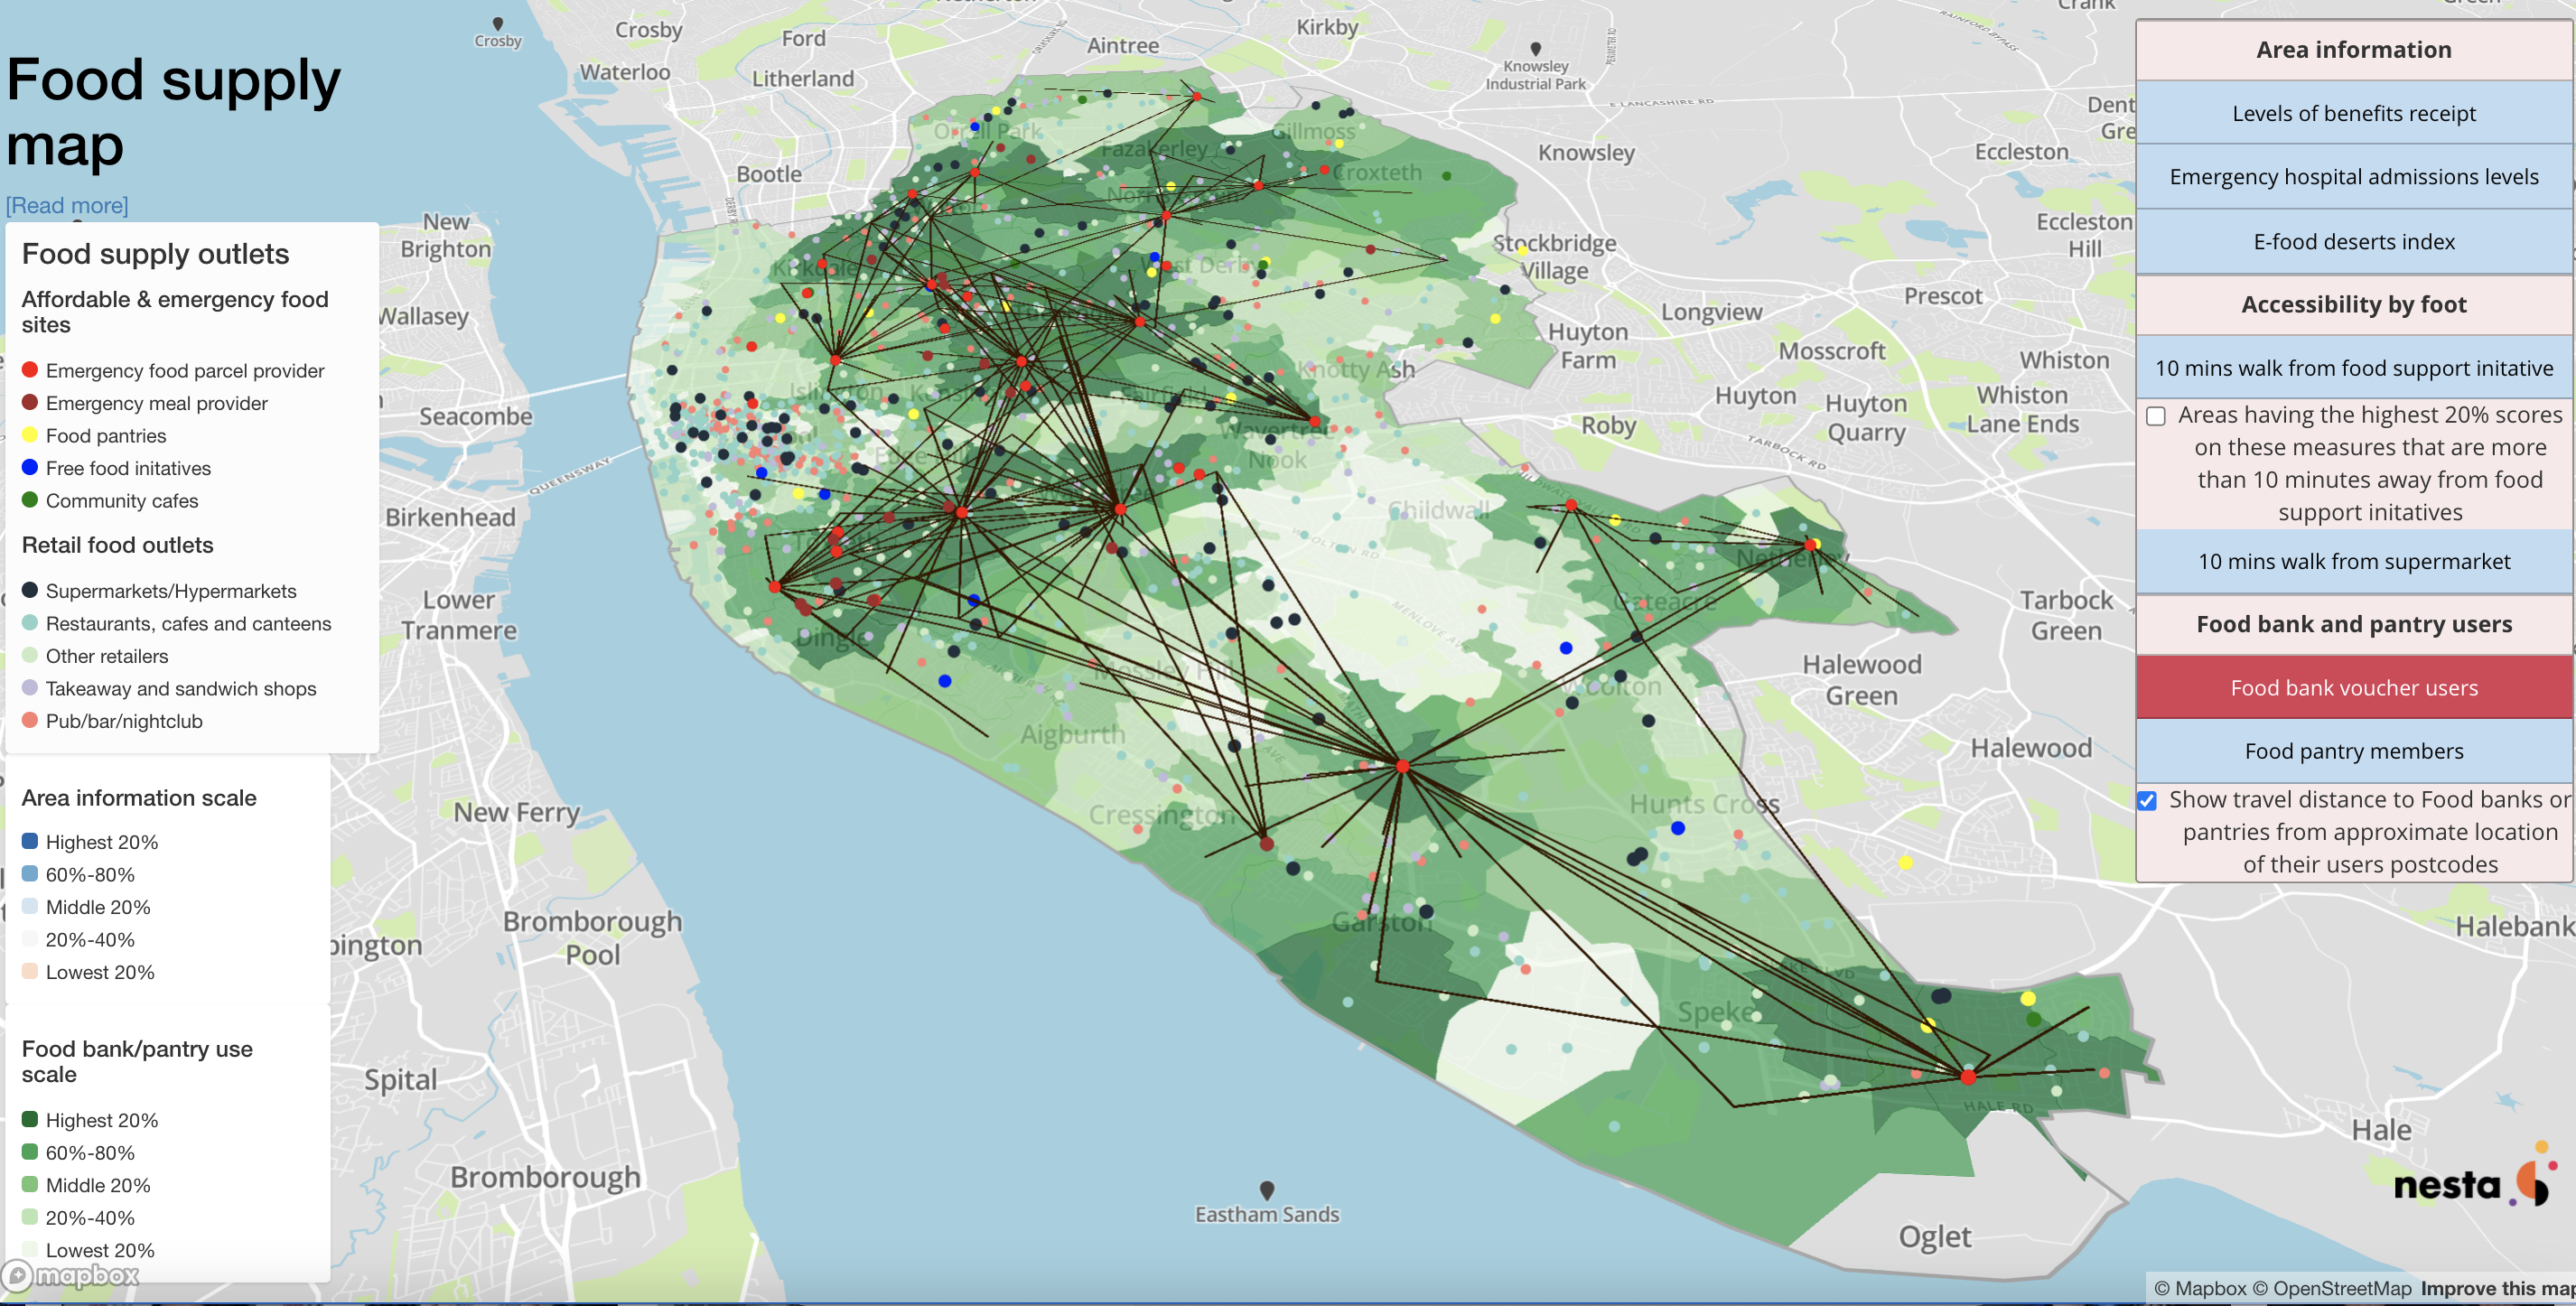 The map showing the approximate location of food bank use
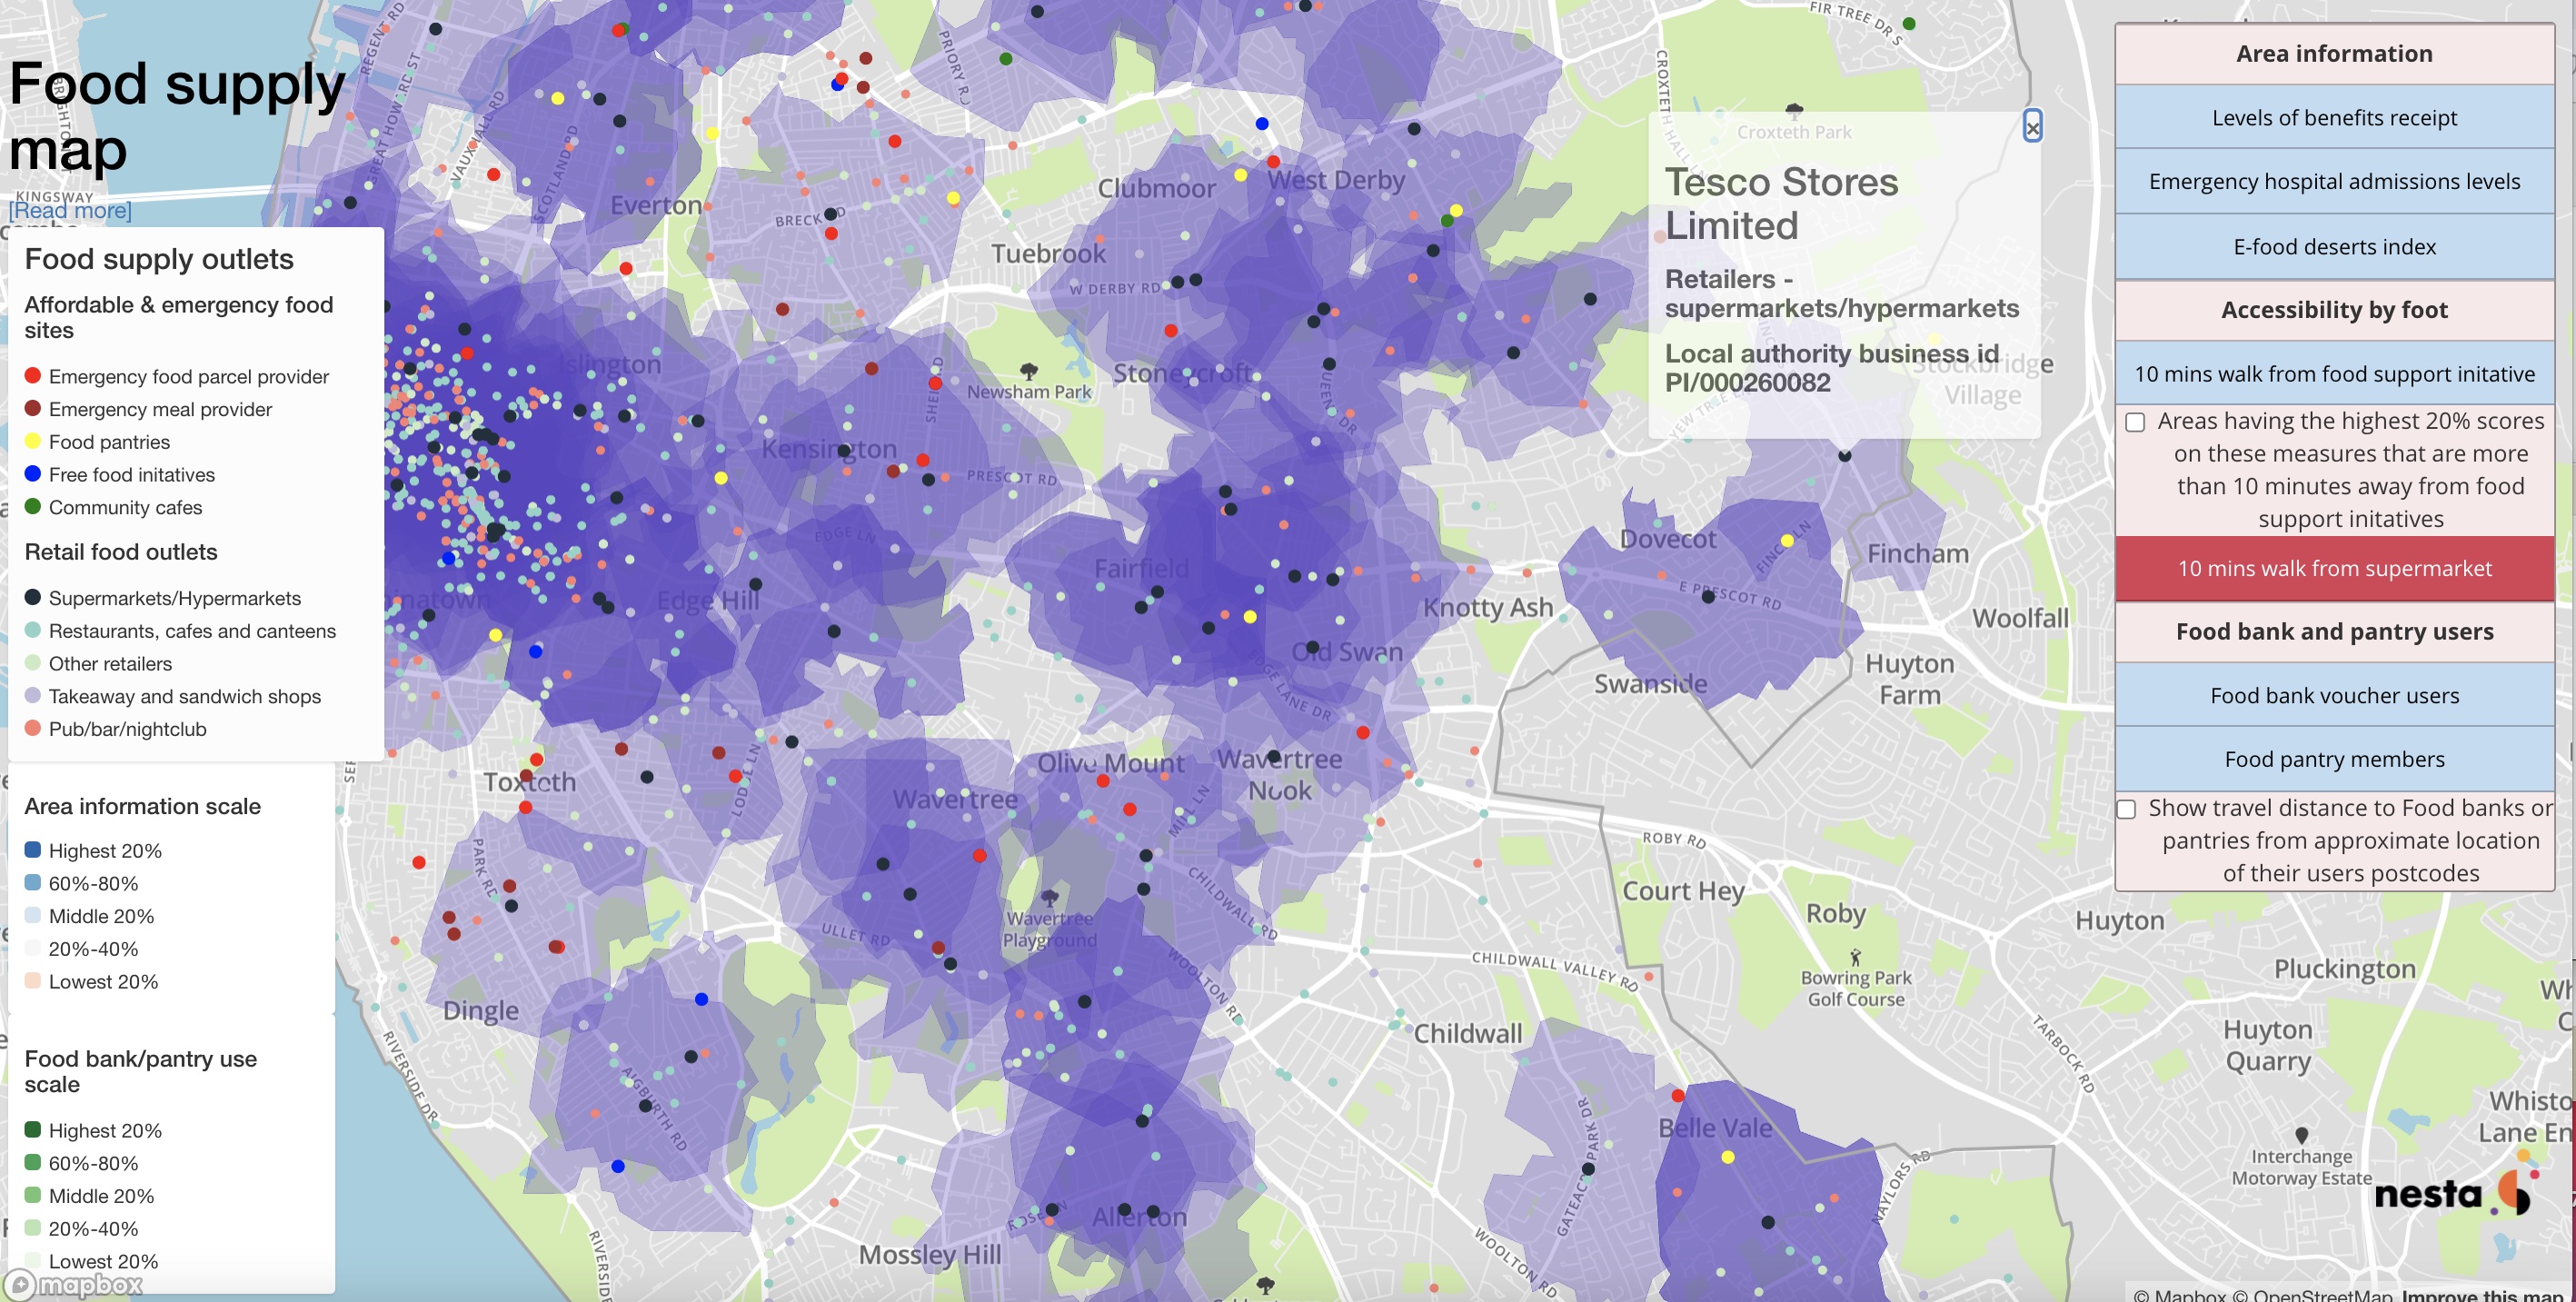 The map showing parts of the city within 10 minutes walk from a supermarket
Using social media data to understand networking at conferences
Hasan Bakhshi, Juan Mateos-Garcia and I developed a methodology
that uses Twitter data to measure networking at conferences.
By examining the network formed between delegates on social media and the strength of connections (such as reciprocal connections and
public interactions) it is possible to develop measures to quantify the networking at an event.
The approach has been applied to the LeWeb tech conference and at other major conferences.
A report on the approach is here and a summary is
here.
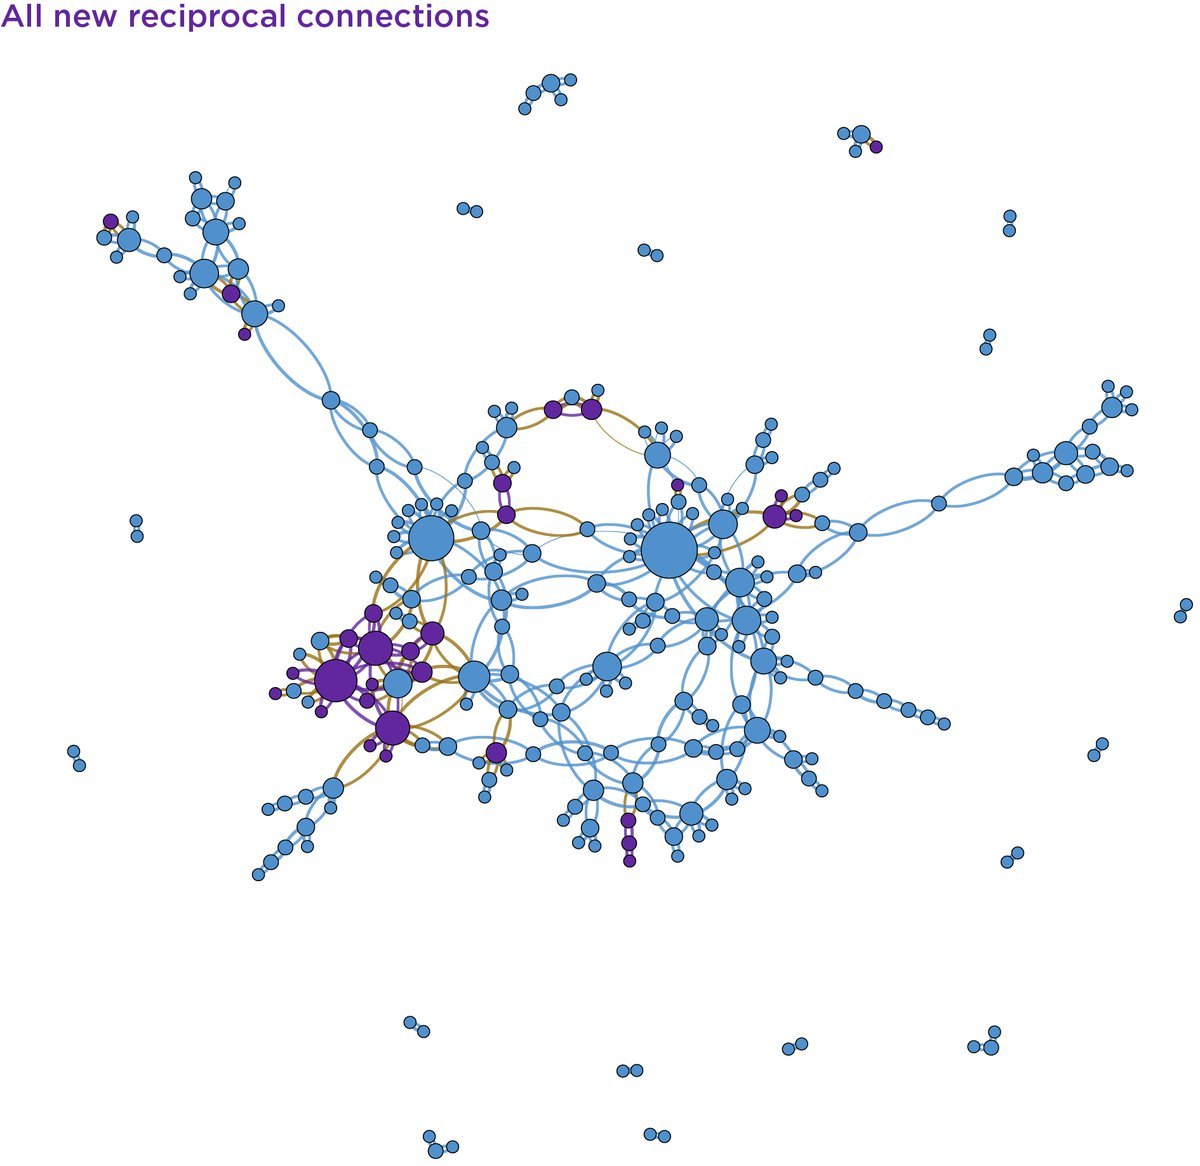 Reciprocal connections formed on Twitter at the LeWeb tech conference
Seeing how people spend their leisure time
I used the survey of leisure activity in England (Taking Part) to visualise for the first time how leisure activities vary across the population. The report I wrote on this is here.