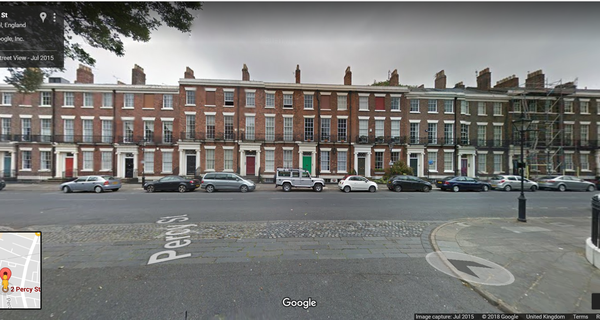
Streets surround us, but, at first glance, there is no systematic data on what they look like. There are records of property transactions, land use and buildings protected due to architectural or historic significance (listed buildings and conservation areas), although none of these directly capture areas’ appearance.
Buildings appearance is though part of planning decisions about the built environment. There is also greater recognition of the importance of areas having a sense of place, but it is not always clear what this means and how to measure it. [1] Recent advances in machine learning and data on the built environment from Google Street View are allowing us to analyse streets appearance directly and may help improve our understanding of places.
A growing number of studies are analysing streets appearance or people’s perceptions of them more directly, for example research has used Street View images and machine learning to identify whether the appearances of streets relate to people’s perception of their safety and computer vision to identify characteristics of places that people associate with beauty. [2] There has also been work on whether it is possible to identify housing style from estate agent photographs. [3]
To give a simple example of this kind of approach, here we see if we can use machine learning to identify a style of architecture in the built environment. The style of architecture we are looking for is one of the UK’s most distinctive: Georgian architecture. This is mainly associated with the period (1714 to 1830) and appears in many towns and cities. Historic Georgian buildings are often protected in the planning regime and, as they are relatively numerous, account for a large number of listed buildings. Modern, Neo-Georgian, town houses are built to this day. [4]
The style is of policy interest due to its combination of high density and perceived popularity. For example, the density of Georgian Terraces in London is about 160 dwellings per hectare compared with the central London density of 78 dwellings per hectare. [5] It has been argued by Create Streets that this kind of street-based, high density, development is one way to increase housing supply that avoids some of the issues with more high-rise development. [6]
To try and detect the style we use Deep Learning, which is one of the developments behind the current excitement around Artificial Intelligence (AI). Computer vision has made substantial progress in recent years using this approach. Deep Learning is based on an idea that is over 70 years old - neural networks. Neural networks have many applications to pattern recognition in images, speech and text. To “train” a neural network to identify images, numbers that represent a digitised image are used as an input into the network. These pass through a series of layers of weights, which are applied to the numbers that represent the picture and then calculate the probability an image contains the particular thing that the network has been trained to detect. Adding more layers of weights (deepening the neural network) and some other refinements in network design and processing have resulted in significant improvements in networks’ performance in image recognition and other tasks. [7] That computers can now potentially identify styles, which are central to many creative domains such art, design, fashion and music points to one of the ways AI is likely to affect the creative industries. [8]
Machines hunting for buildings
To identify these kinds of buildings we use a pre-trained neural network called Inception V3 (shown below). [9] The network is built using an open source framework by Google called TensorFlow. It is not a physical network, but an algorithm that is implemented on the computer as software. The network has already been trained to recognise a large number of images. It has many layers through which the photographic data flows (In the diagram below the blocks correspond to layers and images move left to right through the network). Each layer acts as a filter that implicitly detects different aspects of images e.g. high-level structure as opposed to fine detail. The right-hand side outputs the probabilities that the network estimates that an image contains the things it has been trained to identify and provides the network with feedback on how successful it has been.
The Inception-v3 neural network
 The Street View images we are using are 299 pixels by 299 pixels, with each pixel having 3 colours (red, blue and green). Each colour is represented by a number corresponding to its intensity. So each image consists of 299 x 299 x 3= 268,203 numbers. Although this might sound like a lot of data for a single picture, Street View photos have relatively low resolution, by contrast a megapixel photograph from a phone can have several million pixels.
At a high-level the network is trained to recognise objects by showing it (inputting into it the numbers that represent the picture) a set of images that come from the different target groups we are interested in it recognising. These numbers pass through the weighted layers in the network and ultimately calculate the probability the image contains the objects we are trying to detect. The network’s weights are adjusted to maximise the likelihood that when shown an image from a given category, the network outputs a high probability that it has been shown that category.
In this case, the network has already been trained to recognise a large number of existing objects e.g. different kinds of dogs, cars and so on. [10] As a result its weights implicitly embody a rich understanding of a variety of shapes and textures from the training process it has undergone. We benefit from this by keeping all but one of the layers of the network’s weights the same and retraining the final layer (The layer just before the network splits on the right-hand side) in a process known as transfer learning. [11] Training the full network would be computationally intensive and require more data as it involves estimating the much larger number of parameters for the full network rather than just the final layer.
The network was trained to recognise Georgian architecture by showing it images of the style. These were collected by sampling Street View in London (in particular the locations of listed buildings and conservation areas) and selecting those that I considered had the architecture style of Georgian townhouses. The pictures below show a selection of this data.
The images that the network was trained on: Georgian housing in London
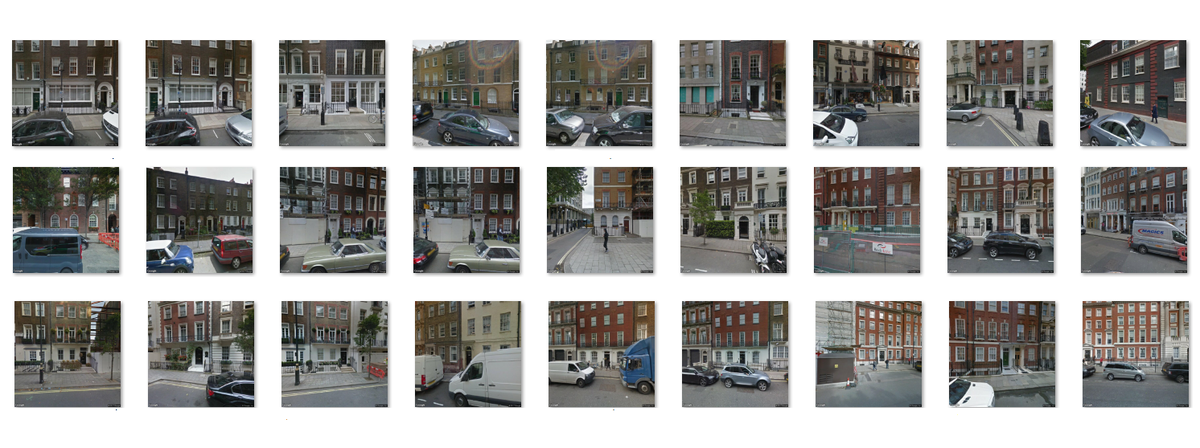
Georgian townhouses are typically brick built and have 3 or more stories. The windows are usually taller in the first two floors with smaller windows in the top floors. The doorway often has an arched window over the door (known as a Fanlight) and ground floor windows can also be arched. The style is not completely uniform, for example the ground floor sometimes has a plaster layer over the brickwork (known as stucco). As the style is not exclusively from the Georgian period, when we refer to Georgian buildings we in practice mean buildings in the Georgian style, rather than the historic period. In buildings subsequent to the period, the plaster can cover the entire frontage, so-called Regency style, but these were not included in the training sample.
How the model does at identifying the style of architecture
The training is undertaken by feeding in pictures (those identified as Georgian and a random selection of Street Views) and adjusting the network weights in the final layer to maximize the probability that the network classifies the image accurately as a random street view or one containing Georgian architecture. The Georgian sample was 713 and the random sample was 3,610.
Part of the sample (20%) is retained to act as a test sample to see if the training had worked. This is because it is possible, as networks have many internal parameters, to calibrate them to fit a training set well. This can be problematic as it may mean that the network has just fit the idiosyncrasies of the particular set of pictures it was trained on and so will be ineffective when facing completely new data it has not seen before.
In classifying pictures (identify architectural styles in this instance) there are two ways the network can get it right and two ways it can get it wrong. Ideally the network identifies the building style correctly when the style is presented to it (true positive) or correctly identifies the style’s absence when it is not present (true negative). However, it can also incorrectly identify the style when it is not there (false positive) and incorrectly say the style is not there when it is (false negative). One of the ways the success of a model is measured is a metric called Accuracy which is the number of True positives and True negatives divided by the number of objects classified. [12] When only correct decisions are made by the classifier i.e. all results are True positives or True negatives the accuracy is a 1. However when there are only False positives and False negatives i.e. the model is alway wrong the accuracy score is 0.
On the test sample an accuracy of 96.7% was achieved after training. This isn’t quite as good as it sounds as by contrast if we just assumed that the picture never contained Georgian architecture, on the grounds that most buildings do not have that style, we’d get an accuracy of 85% in the sample, but it at least indicates some ability to identify Georgian buildings. This is though not perfect and would certainly not be appropriate where there are serious consequences to getting things wrong, such as self-driving cars.
Looking at some other examples from outside the training and test data gives a visual sense of how the network is doing. The network outputs a probability that the building contains Georgian architecture. Where probability 1 is 100% certainty the image is a Georgian townhouse and 0 is complete certainty it is not. As urban environments contain many things other than housing e.g, office buildings, green spaces, roads, scaffolding/building-sites, vehicles or just empty space etc, there is a spectrum of probabilities i.e. a random building looks more Georgian than a bush or empty space.
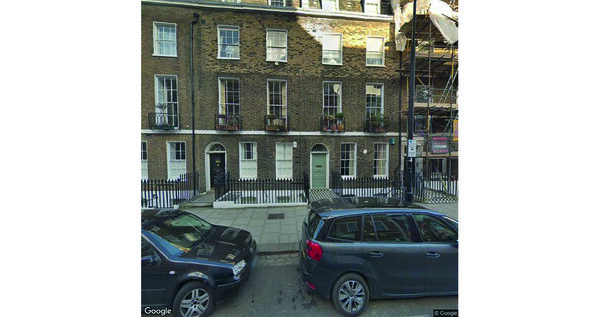 A Georgian House - Probability of being Georgian 0.998
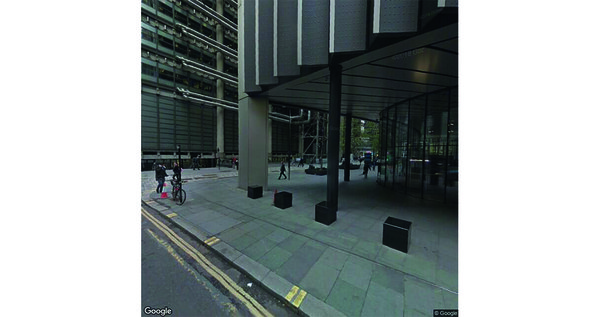 A Modern Office Building - Probability of being Georgian 0.35
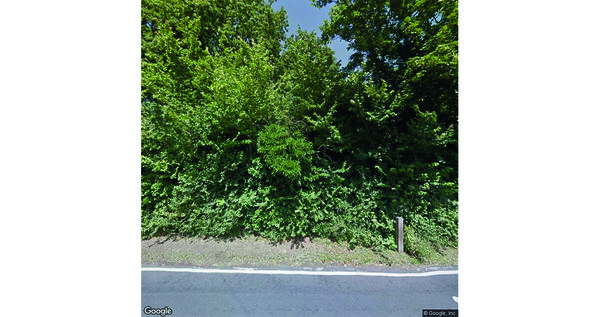 A Bush - Probability of being Georgian 0.0003
Identifying Georgian housing in Liverpool
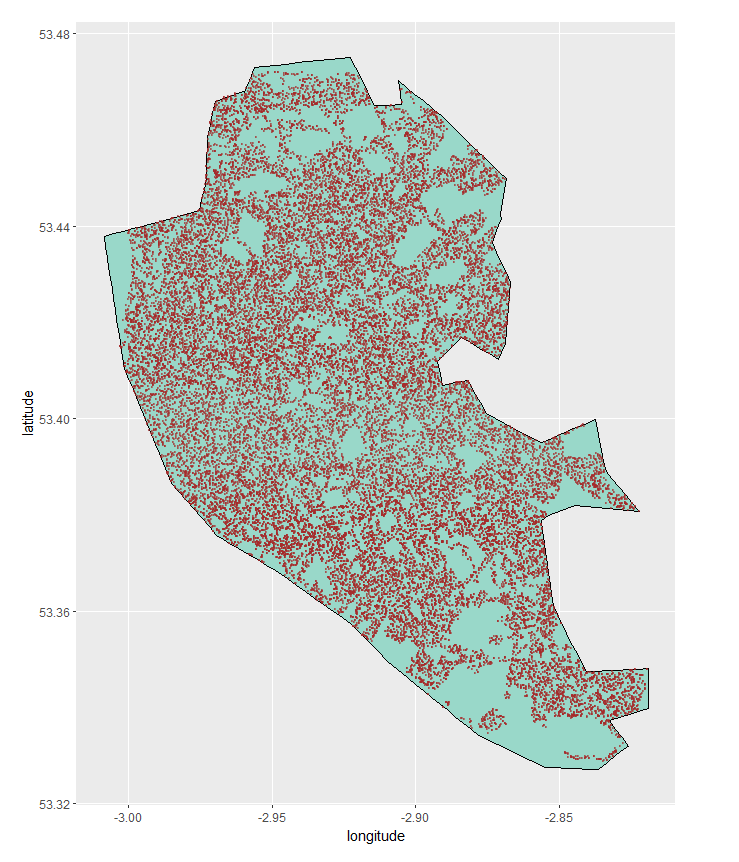
To test if the network is able to recognise Georgian housing we show it street images from somewhere it has not seen any photographs from in the training process and see if it can identify Georgian housing. Liverpool is known for its historic buildings (it is a World Heritage Site) and contains a large stock of Georgian houses. The area corresponding to the Liverpool unitary authority was randomly sampled for 35,000 photographs on Street View. The picture below shows the area sampled, each point is a Street View image with the solid light areas are those where there were no Street View images available.
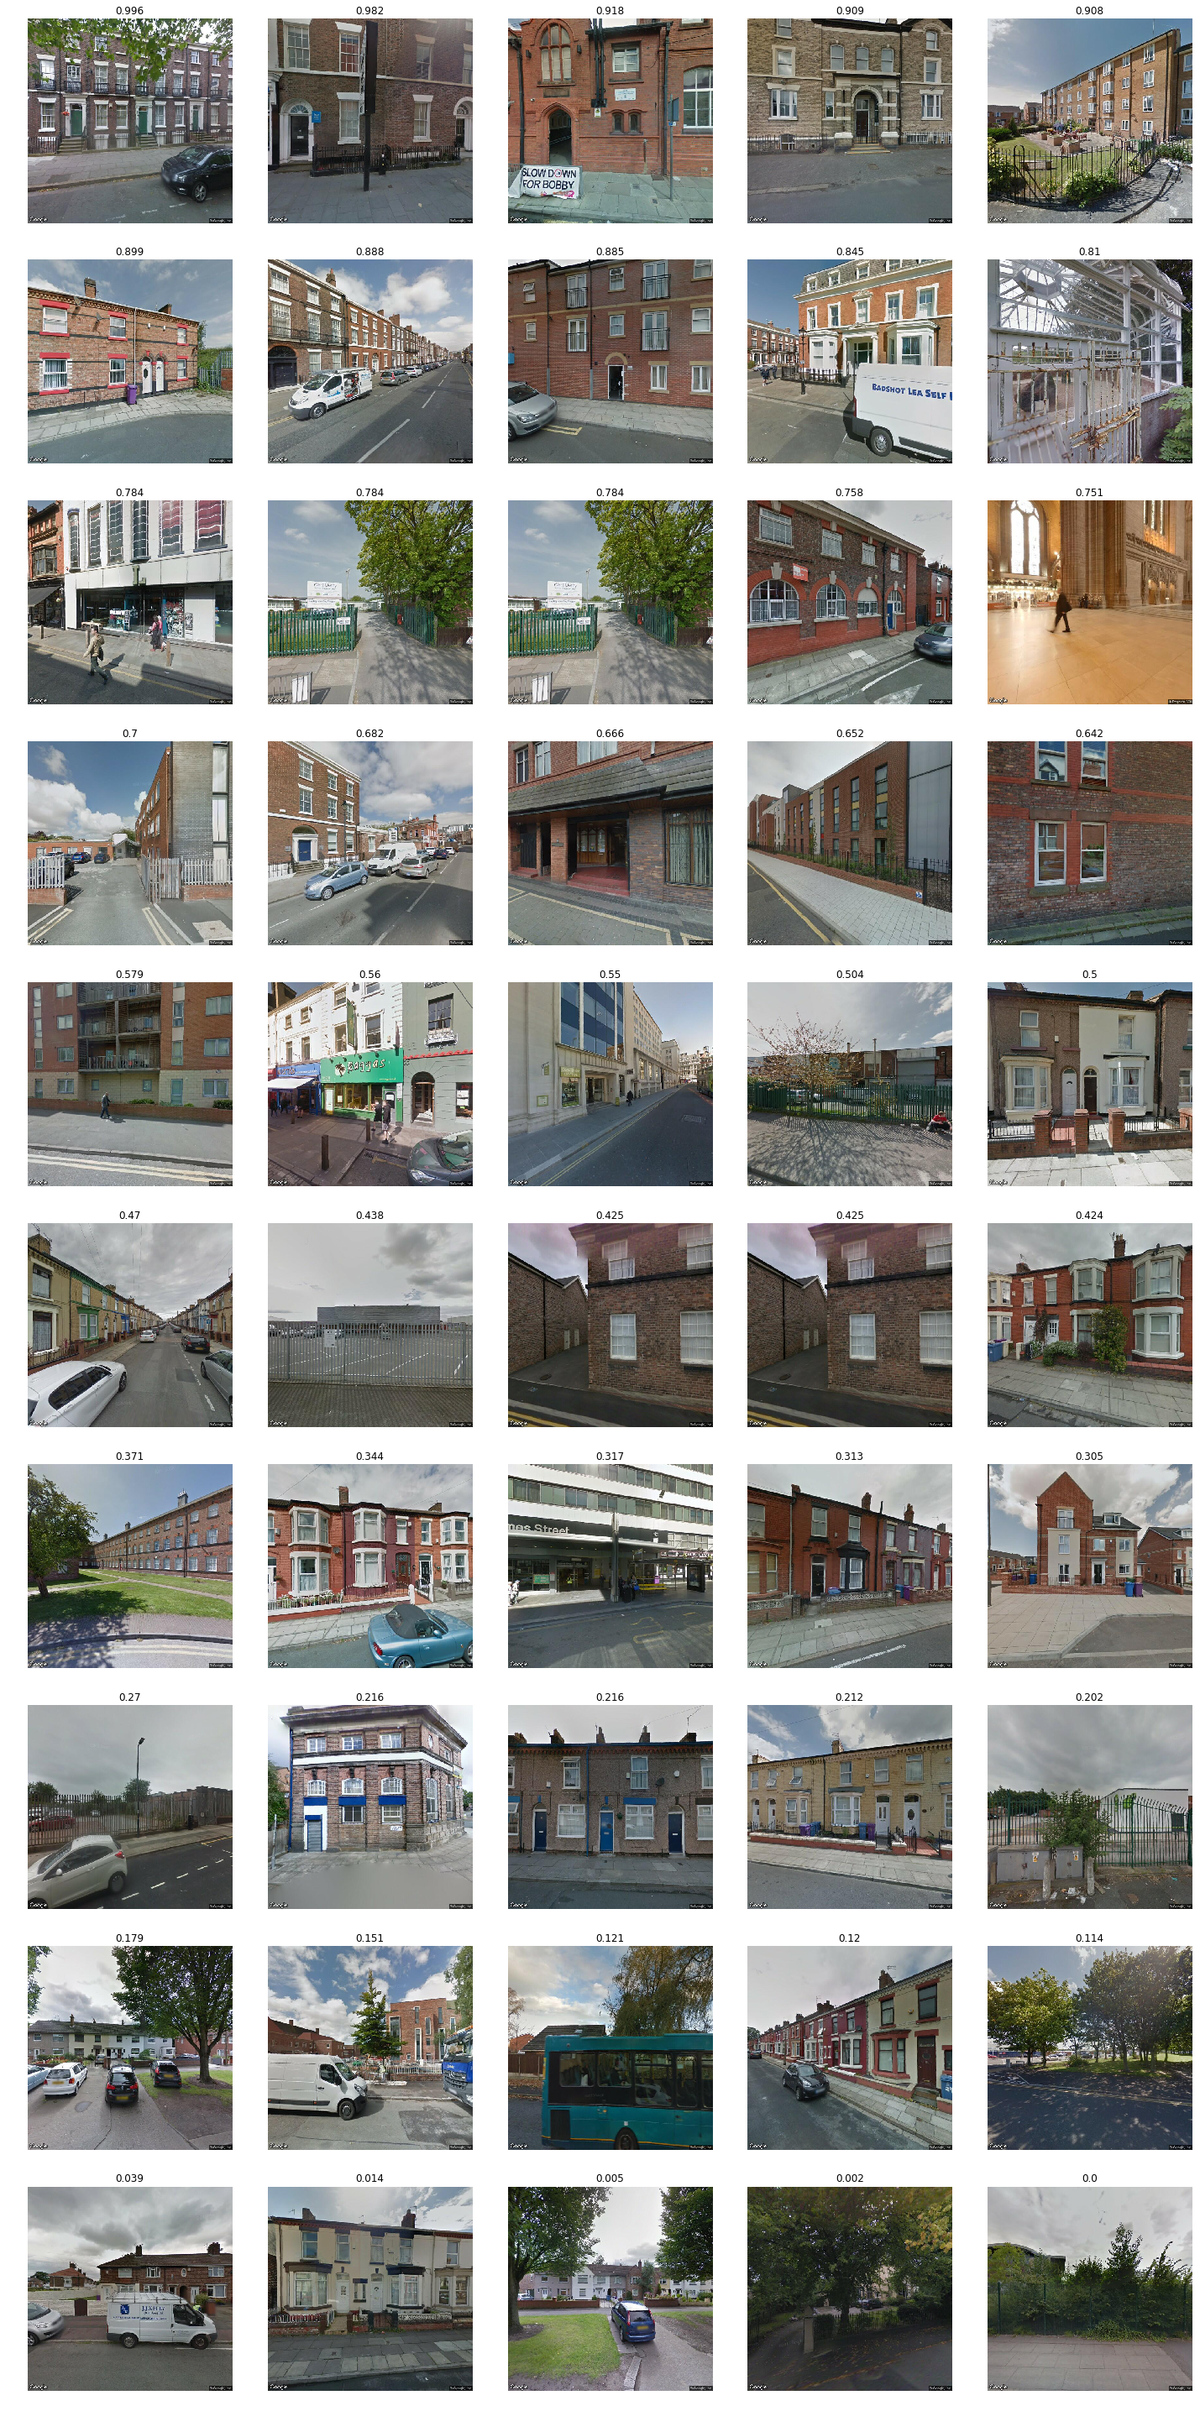
The figure below shows a spectrum of pictures from Liverpool starting with Georgian architecture and ending with lower density development and what the network considers to be the probability of their containing Georgian architecture.
Each level corresponds to pictures drawn from different levels of probability of containing the Georgian style being 0-0.1, 0.1-0.2 and so on. The pictures are not representative of the Liverpool street views overall as most views were given a low probability of containing the style. The first two buildings which have a probability of more than 95% correspond to the style we are looking for.
The photographs that had very low likelihoods of containing the style corresponded to views of lower density housing or open and green spaces. The detection of the style is likely to being partly driven by the size of the building as much as its appearance i.e. Georgian townhouses are bigger than those in the suburbs and have higher density, but it is also true that these characteristics are an integral, although not exclusive, part of the style.
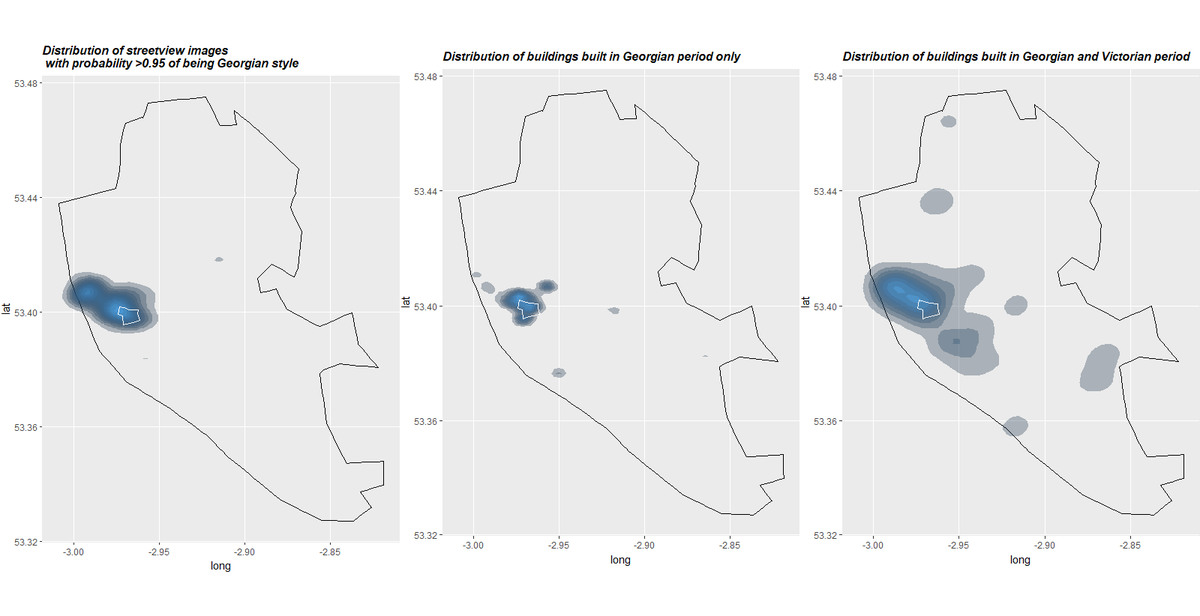
 The figure below plots the locations of the photographs identified as containing a Georgian building with more than 95% probability (on the left) compared to listed buildings locations in Liverpool (on the right). We see that the locations of the main concentrations of buildings identified by the network broadly corresponds to the area that has the highest number of listed buildings in Liverpool.
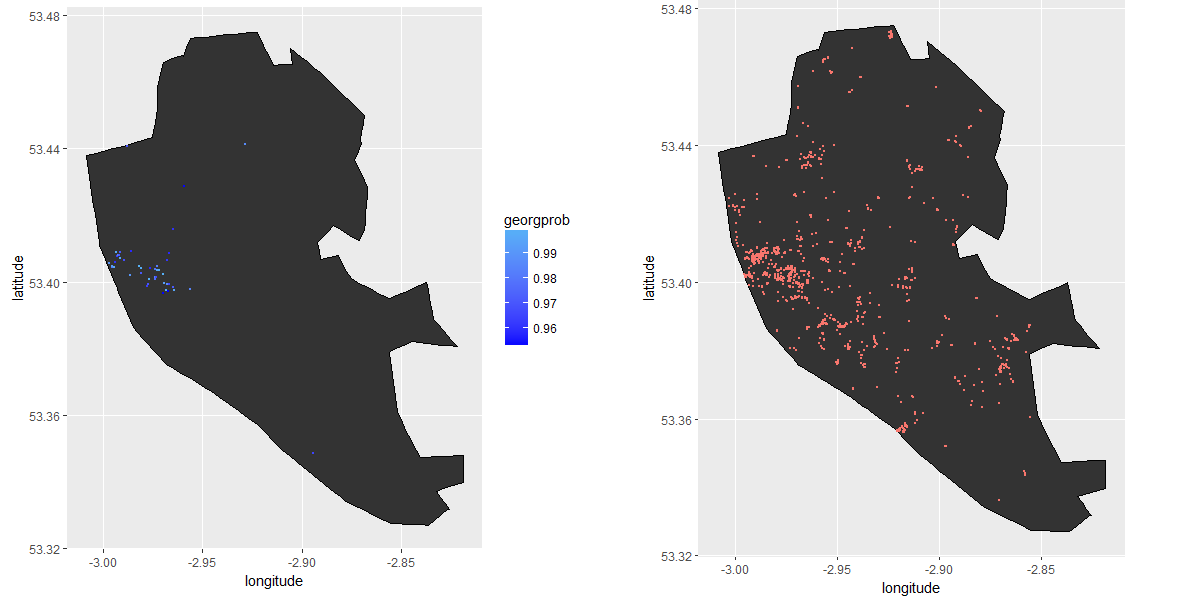
Liverpool Georgian building identification One would not expect the exact identification of isolated or low density examples of the style as there are more buildings in Liverpool than our collection of Street Views. A query for buildings in Liverpool run on OpenStreetMap returns over 100,000 buildings which is likely to understate the true number.
We compare the density of historic buildings with the density of photographs that the network considers as having a high probability of being Georgian in the figure below. On the right hand-side we have separated out the density of historic buildings into two types listed building built in the Georgian period (1714-1830) and in addition the neighbouring Victorian period (1837-1901). The part of Liverpool that is known as the Georgian Quarter (shown in white outline below), which also is the area with the highest density of historic Georgian buildings in the city falls within the area assessed to have a high probability of being Georgian. There is also another area which is identified as having a high probability of buildings with Georgian style to the north west of the Georgian quarter, but which does not contain large numbers of Georgian buildings. It does though contain a lot of Victorian buildings and inspection of the images suggests that the network is mistakenly classifying a significant number of buildings which do not have the Georgian style, but which often have certain kinds of period features such as rounded window arches or leaded windows. It also likely that the higher density is playing a role.
Distribution of areas identified as having a high probability of being Georgian and with high levels of Georgian and Victorian architecture.
The pictures below gives some examples of buildings that the network correctly and incorrectly classified as being Georgian with high probability.
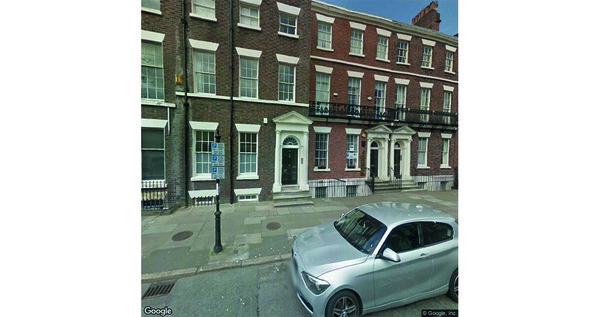 Correct classification - Probability of being Georgian 0.985
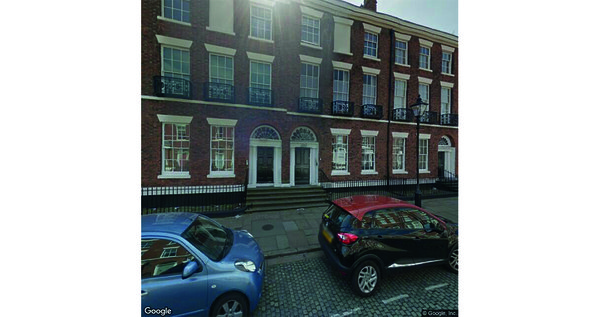 Correct classification - Probability of being Georgian 0.9931
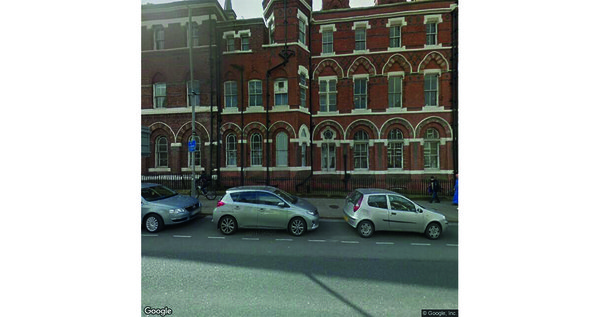 Incorrect classification - Probability of being Georgian 0.9983
Conclusions
This simple example has shown that we are able to use machine learning to identify areas with high concentrations of Georgian architecture using a network trained on data from a different location. However, there are a significant number of false positives, where buildings that are not Georgian, but which have features that are part of the style, such as leaded windows, or rounded arches, are identified as having a high probability of being Georgian. These false positives being largely in areas where there are a high number of buildings from the neighbouring Victorian period, as opposed to newer buildings.
It should be possible to improve the performance of the network by using a larger sample of training data (our sample is fairly small) and finer distinctions on architectural style (perhaps from someone whose primary qualification isn’t economics), more sophisticated techniques to sample Street View to generate more consistent photographs and by optimising the network. Alternatively one could more directly pre-process the images before the analysis - this is implicitly what the pre-trained earlier layers of the network are doing, but one could use a more specialised approach by extracting specific features of the image relating to the architecture style, or retraining more layers of the network.
Another extension would be to use GIS / land use and land registry data to inform the analysis, by supplementing the data with information on when transactions relating to the land on which the property sits were undertaken. [13] Also by only having the classifier allocate pictures to only two classes: Georgian or non-Georgian we are not controlling for other styles in a particularly sophisticated way and indeed there is variation within the style (such as having plaster on the ground floor which can substantially affect its appearance). The analysis could be extended to other styles, by for example sampling conservation areas to provide examples of specific styles that can be used to train the network to identify the style elsewhere.
Implications of being able to understand streets appearance better
Although the analysis has only been partially successful in identifying the architectural style, the approach adopted is not that sophisticated and it is plausible that it could be elaborated on to get more accurate findings. As more work is done on understanding streets appearance directly there may be some implications as this kind of analysis increases.
Measuring the built environment better
The extent to which local authorities have systematic records of what the built environment looks like outside of conservation areas is limited. In principle this sort of approach could be used to develop a systematic measure of streets appearance supplementing existing quantitative information from Geographic Information Systems (GIS), for example information on land use. In a different context the Office for National Statistics (ONS) has worked on assessing the extent to which it is possible to identify caravan parks from aerial imagery as caravan parks dwelling numbers are poorly recorded. [14] The mapping of the built environment is not just about the kinds of buildings. Buildings falling into disuse or disrepair can have a profound effect on the ability to maintain them and on surrounding areas. In the context of historic buildings, Historic England has a register of the number of listed buildings and conservation areas that are at risk, but owing to there being 500,000 listed buildings in England it is not practically possible to directly monitor whether they are all at risk so only the highest grades of listed buildings are systematically examined. Assessing whether buildings are at risk is not necessarily an easy issue to address through visual imagery (Satellite or Street View) as buildings and structures at risk will not always show a clear visible external signs of being at risk, and almost certainly harder than identifying a specific style, but in future it may provide one way to address the issue as techniques improve and more historic data (it is now possible to look at Street View images over time) becomes available.
Understanding what people like about streets
There is evidence that consistency of style is appreciated by people as evidenced by the fact that conservation areas, which tend to have a consistent style, tend to have higher house prices adjusting for other factors that affect prices. [15] Understanding more directly what people like about streets, opens up the way to systematically design streets in a way that improves people’s experience. People can be shown lots of images of streets in a kind of visual survey and indicate which ones they like. Then, rather than get the network to identify the architecture directly, the network can be trained to recognise places that people like and identify their characteristics.This has already been done in the context of work by MIT media lab on whether people thought a street was safe or not in the US and researchers at Warwick business school who have analysed beauty in outdoor places in the UK. [16] As we learn more through these sorts of studies it should be possible to take a more informed approach for new developments as understanding improves.
Combining crowdsourcing and machine learning for wider good
One of the ways machine learning may help us understand the built environment is by using it to compliment crowdsourcing techniques. There are already very well established spatial crowdsourcing initiatives such as OpenStreetMap. More recently in 2017 the Colouring London initiative launched a web platform to collect information on every London building via crowdsourcing. Data being collected includes building age, use, type size, designation status and rebuild history. The company Mapillary is using crowd sourcing to collect images of streets which it then uses machine learning to analyse things like the location of street signs.
A challenge in training machine learning algorithms is that generating a large enough sample of appropriate training data can be time consuming (It took several days to collect and then process the relatively small training sample used here). One way to address this is to get people to classify pictures as a by-product of another activity. This is what is often happening when website captchas ask us to identify cars or street signs in photographs or to identify letters from a tangled group. This process of human classification is effectively labelling the data to generate a test set that machine learning algorithms can then be trained on to, for example, help cars navigate around streets. It is also implicitly happening when we click on web-pages indicating content that we like and are more interested in. This is in turn training algorithms to show us content that means we are likely to spend longer on sites.
A number of the examples referred to here use crowdsourcing to collect their data and recently the Ordnance Survey used its employees to label images to help classify roofs from Satellite imagery. [17] Using volunteers to crowdsource training sets on areas that there is interest in measuring, and then scaling up their efforts by machine learning, may open up the potential to use artificial intelligence to leverage collective intelligence for the wider good. [18]
Acknowledgements
The author would like to thank Hasan Bakhshi, Alex Bishop, Luca Bonavita, Jyldyz Djumalieva, Eliza Easton, Joel Klinger, Duncan McCallum, Adala Leeson, Antonio Lima, Henry Owen-John, Cath Sleeman, Kostas Stathoulopoulos and Nyangala Zolho. All errors are my own.
The mapping code is available at
https://github.com/johnardavies/Georgian-buildings-project
If you want to use the network and photos please get in touch.
References
[1] Brown, R., Hanna, K. and Holdsworth, R. (2017), ‘Making good - shaping places for people’, Centre for London.
[2] Naik, N., Philipoom, J., Raskar, R. and Hidalgo, C. (2014), ‘Streetscore-Predicting the Perceived Safety of One Million Streetscapes’, CVPR Workshop on Web-scale Vision and Social Media. Querica, D., O, Hare, N. and Cramer, C, (2014), ‘Aesthetic capital: what makes london look beautiful, quiet, and happy?’, Proceeding CSCW ‘14.
[3] Pesto, C. (2017) ‘Classifying U.S. Houses by Architectural Style Using Convolutional Neural Networks’.
[4] Clemoes, C. (2014), ‘Houses as Money: The Georgian Townhouse in London’, Failedarchitecture.com.
[5] Ibid, p11.
[6] Boys Smith, N. and Morton, A, ‘Create Streets’, Policy Exchange.
[7] Dahl, G.,Sainath, T. and Hinton, G. (2013), ‘Improving DNNs for LVCSR using rectified linear units and dropout’, CASSP.
[8] Elgammal, A. , Mazzone, M., Bingchen, Liu., Kim, D. and Elhoseiny, M. (2018), ‘The Shape of Art History in the Eyes of the Machine’ arXiv:1801.07729. Vittayakorn, S. , Yamaguchi, K., Berg, A. and Berg, T. ‘Runway to Realway: Visual Analysis of Fashion’. Van den Oord, A, Dieleman, S. et al , ‘WaveNet: A Generative Model for Raw Audio’.
[9] Szegedy, C., Vanhoucke, V., Ioffe, S., Shlens, J. and Wojna, Z. (2015), ‘Rethinking the Inception Architecture for Computer Vision’, arXiv:1512.00567.
[10] Inception V3 was trained on the ImageNet Large Visual Recognition Challenge, a standard challenge in computer vision, where the classifier tries to identify an image as being one of 1000 classes.
[11]Tensorflow (2018), ‘How to Retrain an Image Classifier for New Categories’, https://www.tensorflow.org/hub/tutorials/image_retraining.
[12] Mathematically accuracy corresponds to the sum of True Negatives and True Positives divided by the sum of True Negatives, True Positives, False Positives and False Negatives.
[13] The Land registry has information on land transactions, but does not itself have information on the age of buildings on the land, unless it is implicit i.e. when the developer sells the land. https://hmlandregistry.blog.gov.uk/2018/01/26/how-old-is-my-house/.
[14] ONS methodology working paper series number 15 – Feasibility study: Caravan parks recognition in aerial imagery.
[15] Ahlfeldt, G., Holman, N. and Wendland, G. (2012), ‘An assessment of the effects of conservation areas on values’, English Heritage.
[16] Seresinhe, C.I., Preis, T., Moat, H.S., (2017) “Using deep learning to quantify the beauty of outdoor places.” Royal Society Open Science.
[17] Orlowski, A. (2017), ‘UK’s map maker Ordnance Survey plays with robo roof detector’, the Register.
[18] Mulgan, G. and Baeck, P. (2018). ‘Developing a new Centre For Collective Intelligence Design’, Nesta. Mulgan, G, (2018), ‘AI is for good, but is it for real’, Nesta.
